


| Contents |
|
- General
- Searching for mutually exclusive genes
- Select genes
- Using the Advanced Options
- The Result View
| General | Back to top |
Eukaryotes can enhance their repertoire of different protein products by alternative splicing of the corresponding genes. One of the different types of alternative splicing is called mutually exclusive splicing and is used for clusters of internal exons that are spliced in a mutually exclusive manner. It is important to note that the term mutually exclusive splicing is only used for these specific clusters of exons. Mutually exclusive splicing demands a specific mechanism for the regulated splicing of exactly one of the exons of such a cluster. Recent analyses have shown that this mechanism might be based on intra-intronic RNA pairings that are conserved at the secondary structure level. These alternatively spliced exons must not be mixed up with exons that seem to be spliced in a mutually exclusive manner based on their annotation. This especially accounts for terminal exons that are alternatively spliced in conjunction with the use of alternative promoters or 3'-end processing sites. The regulation of the splicing of these types need not be at the level of splicing.
In general exons of a cluster of mutually exclusive exons encode the same region and thus the same secondary structural elements of the resulting protein structure. The preconditions for mutually exclusive exons are therefore A) similar length (sequence length should be fixed in regions forming α-helices and β-strands but slightly flexible in loop regions), B) conserved splice site patterns (only certain combinations of 5'- and 3'-splice sites are possible, e.g. GT---AG, GC---AG, and AT---AC), C) the preservation of the reading frame, and D) sequence homology.
Like other exons, mutually exclusive exons can be of any length, and the homology of the exons within a cluster can range from high to low. Given these characteristics alone the prediction of mutually exclusive exons for all annotated genes of whole genomes is a very ambitious aim. Nevertheless, the most important requirement is a dataset of well-annotated genes. Here, we have predicted the mutually exclusive genome for several species, mainly from model organisms, which are known for their - most probably - well-annotated genomes. Because a set of standard parameters might not be sufficient to identify potentially mutually exclusive exons for all exons, we performed the prediction with somewhat loose parameters. This way we might have also introduced some false predictions in the database, especially for short exons. However, the standard parameters for the search via the web interface are rather strict excluding these false predictions, but the user can still loosen the parameters to see potential further results without having to repeat the whole prediction.
| Searching for mutually exclusive genes | Back to top |
Clusters of mutually exclusive genes can be searched in two ways:
A) Search based on sequence homology
B) Select a specific gene, a genomic region, or a whole genome
Homology-based search
If you want to search with your protein of interest for homologs in Kassiopeia, the best would be to use the BLAST service. In the result view the taxonomic branch of the hit (e.g. plant or insect) is indicated as well as whether the result hit contains mutually exclusive exons. By clicking on the results hit you will be re-directed to a page containing all details for the specific hit as available in Kassiopeia (see below for the explanation of the result view).
Target driven search
In the main menu the species, for which predicted mutually exclusive exonomes are available, are sorted by taxons. Taxons contain the datasets of several species, of which one has to be selected on the taxon page.
| Select genes | Back to top |
Select all genes or subsets of specific genes
Either all or one or more specific subsets of genes of the selected dataset can be selected. Specific subsets include A) all genes with predicted mutually exclusive exons independently of their positions within the genes, B) genes with mutually exclusive exons at certain positions within the genes (initial, internal, or terminal exons), C) genes with mutually exclusive exons that were already included in the annotation, and D) genes with exons that were annotated as constitutive but meet the criteria of mutually exclusive exons. The gene annotations of most species do not contain isoforms representing alternatively spliced genes. In these species all exons are annotated as constitutive irrespectively of whether they are differentially included, mutually exclusive spliced or of any other type of alternatively spliced exons. This accounts for example for the annotations of all Drosophila species except Drosophila melanogaster. In these species, for example the exons of the clusters of mutually exclusive spliced exons in the well-known myosin heavy chain and Dscam genes are annotated as constitutive. In order to provide the user the most comprehensive and extensive set of genes containing mutually exclusive spliced exons, the genes with predicted mutually exclusive exons and the genes with constitutive exons meeting the criteria of mutually exclusive exons are preselected.
| Using the Advanced Options | Back to top |
Search by protein names or identifiers
If a specific gene is searched to analyse whether potential clusters of mutually exclusive exons have been predicted, it can be found by providing a protein or gene name, or by entering a GenBank ID, an NCBI gi number, or a gene id as used in species-specific databases like Flybase or Wormbase.
Additional search constraints
As additional constraint the analysis of genes containing mutually exclusive exons can be restricted to specific chromosomes or supercontigs.
Filtering mutually exclusive exon candidates
Length difference
This parameter determines the minimal and maximal difference between the length of the original exon and the length of the corresponding alternative exon. The unit of the length is amino acids, and the value for the difference applies to each pair of original and putative alternative exon. Given a minimal length for exons of e.g. 10 residues, considerably longer false positive exon candidates (e.g. +20 residues) with same splice sites and reading frame and showing sequence homology will rarely be found. The parameter has rather been introduced to exclude potential false positive predictions for shorter exons.

Example: Exons 1, 2b and 3 are the original exons. The standard value for the maximal length difference is 20 residues thus including all predicted exons, exons 2a, 2c and 2d, in the result. If the maximal length difference is set to less than 12 amino acids, exons 2a and 2d will be filtered out.
Similarity score
A score is calculated for the quotient of the ratio of the global alignment of the translated exon sequence to the translation of the corresponding alternative exon to the ratio of the global alignment of the exon translation to itself. All alternative exon with a value between the minimal and maximal score are shown in the results.

Example: Exons 1, 2b and 3 are the original exons. The standard values for the minimal and maximal score are 10 and 100, respectively, thus including all predicted exons, exons 2a, 2c and 2d, in the result. If the minimal score is set to more than 10%, exon 2c will be filtered out.
Original exon length
Predicted mutually exclusive exons will only be shown for those original exons, which are longer than the given minimal exon length. This parameter has been introduced in order to exclude the many false positive exon candidates that are found for short exons (< 8 residues) because of their naturally low complexity. Especially, false positives were found in up- and downstream regions because of the longer target sequences compared to average intron regions. The length is defined as number of amino acids.

Example: Exons 1, 2b and 3 are the original exons. The standard value for the minimal original exon length is 10 thus including all predicted exons, exons 2a, 2c and 2d, in the result. If the minimal original exon length is set to more than 18 amino acids, all predicted exons will be filtered out.
In all or surrounding introns
Gene annotations contain mis-predicted coding sequence in many genes. These might include exons, that are missing in the predicted genes, and intronic sequence, that has been mis-interpreted as exonic. In the latter case, mutually exclusive exon candidates might also be identified in the introns before or after the annotated neighbouring exons. In addition, by searching exon candidates in all introns potentially trans-spliced genes and tandem gene duplicates might be identified. By default, mutually exclusive exons candidates for every exon were searched in all introns of an annotated gene in the prediction pipeline. However, because the main intention of Kassiopeia is to provide a basis for the analysis of clusters of mutually exclusive spliced exons, the standard setting for this filter is to show only exon candidates found in surrounding introns in the search results.

Example: Exons 1, 2, 3b and 4 are the original exons. In the standard settings only those mutually exclusive exons will be included in the search results that were predicted in the introns surrounding the original exon. If the option all introns is selected, exon 3a will also appear in the search results.
Up- and downstream
This filter determines the length of the up- and downstream regions in which mutually exclusive spliced exon candidates will be shown in the result view. In the prediction pipeline we searched with all exons in up- and downstream regions of up to 20,000 bp. Because the termini of the genes are the most difficult parts of genes to predict, many gene annotations most probably miss the true termini or contain mispredicted termini in many cases. In these cases, clusters of mutually exclusive exons are actually clusters of internal exons and not terminal exons. Therefore, exon candidates in up- and downstream regions can be shown in the result view although the region is set to 0 bp in the standard settings.

Example: Exons 1, 2 and 3a are the original exons. In the standard settings mutually exclusive exon predictions in up- and downstream regions are excluded from the search results in order to filter most of the mutually exclusive exon candidates for terminal exons, potential trans-spliced genes and tandem gene duplicates. Depending on the specified length for the up- and downstream region the exon candidates 3b and 3c will be shown.
Predicted exons overlapping but not matching exons of other protein isoforms
In annotations containing alternative splicing events several annotated genes map to the same locus. Because candidates for mutually exclusive exons were searched for every exon of every isoform, and not for a merged gene combining all exons of all isoforms, it can happen that predicted exons in one isoform overlap with original exons of another isoform. This would actually be the normal case, if all mutually exclusive exons were annotated: The annotated isoforms would each contain one of the mutually exclusive exons of the cluster, and the other exons of the cluster would be found when searching in each isoform for mutually exclusive exons. However, often predicted exons overlap but do not completely match exons in other isoforms. With this filter, these overlapping exons can be excluded from the search results.
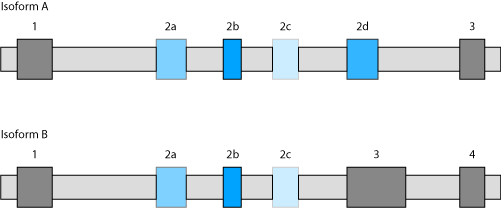
Example: Exons 1, 2b, and 3, and exons 1, 2b, 3, and 4 are the original exons of Isoform A and Isoform B, respectively. In the standard settings predicted mutually exclusive exons overlapping with annotated exons of other isoforms are retained in the search results even if the predicted exons do not exactly match exons of other isoforms. If this option is deselected in the example, exon 2d in Isoform A will be excluded from the search results.
| The Result View | Back to top |
Explaining the gene structure schemes
In general, the exon-intron structure of genes is visualized by dark-grey and light-grey boxes, respectively. In very rare cases, in which the annotated protein sequence could not completely be mapped to the target genome sequence, the reason(s) and position(s) of the discrepancies are given as for example "intron?", "gap", or "mismatch". Mutually exclusive spliced exons are shown in colour with exons of a cluster having the same colour and the similarity of the predicted exons to the original exon being represented by brightness (the original exon having the brightest colour). Annotated mutually exclusive exons, that were verified by cDNA/EST data, are denoted with bold borders, and annotated exons without further external support are marked with thin borders. Predicted exons, that are not in the annotations, are denoted with dashed borders. Constitutive exons meeting the criteria of mutually exclusive exons are marked with bold dark-green borders.
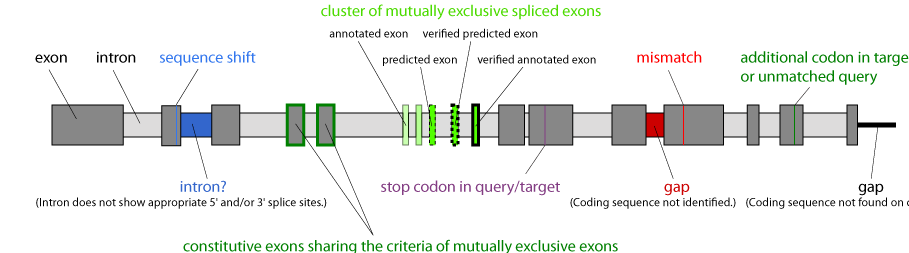
Legend: The scheme of a hypothetical gene shows the colour code for exons, introns, mutually exclusive spliced exons, and the various possible discrepancies between the protein sequence and the target genome sequence.
Further evidence supporting the mutually exclusive exon candidates
Below the gene structure schemes, further information to the mutually exclusive spliced exons and additional data adding confidence to the predictions can be opened.
Sequence and secondary structure alignments
For every cluster of mutually exclusive exons the multiple sequence alignment of the exons including the score of the predicted exons can be examined. Below the sequence alignment, the alignment of the predicted protein secondary structures of the exons is shown. The confidence of the prediction is denoted by scaling the predictions from week (light-grey) to strong (black). "H" represents α-helical and "E" β-strand propensity.
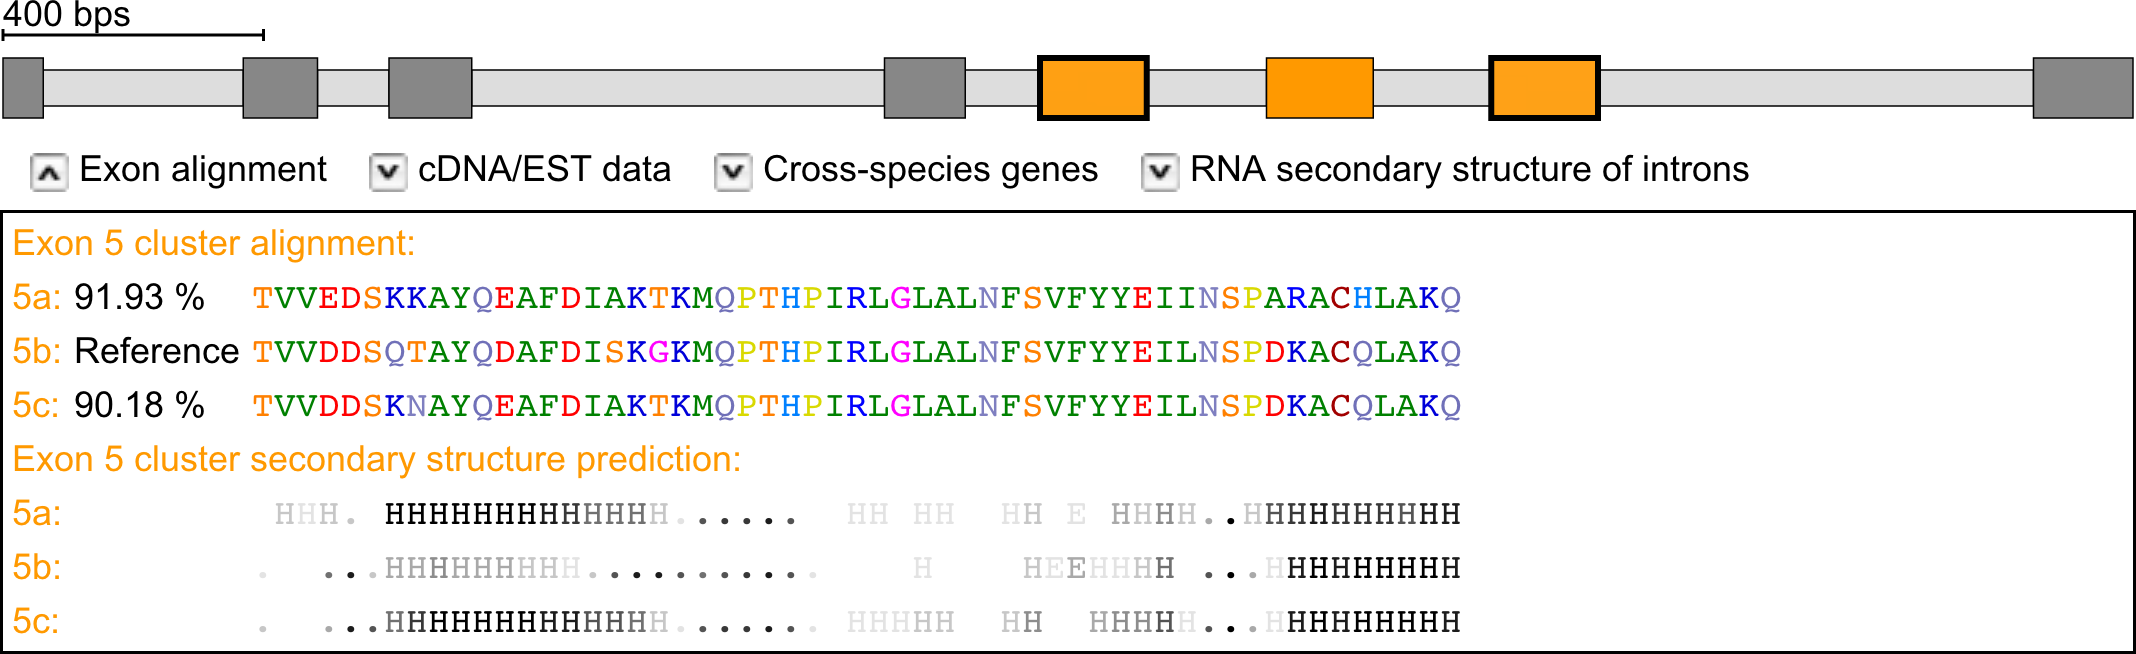
Example: Exon-intron structure of the Drosophila melanogaster 14-3-3ζ gene containing a cluster of three mutually exclusive exons of which the outer exons are supported by cDNA/EST data (marked with bold borders). Multiple sequence and secondary structure prediction alignments of the mutually exclusive exons.
Mapping of cDNA/EST clones
cDNA/EST data was mapped against all genes that contain predicted mutually exclusive exons based on standard parameters. The search for mapping cDNA/EST clones has been performed based on the annotated protein sequence while the actual mapping was done at the nucleotide level. The scheme on the top of the cDNA/EST hits represents a summary of the mapping of all clones. Coloured parts denote regions that are mapped by at least one clone. Below, the mapping of every single cDNA/EST clone is shown with the same colour coding as in Figure 1. Red horizontal bars instead of introns represent regions in which cDNA/EST data could not be mapped, red vertical lines represent mismatches between the translated cDNA/EST and the annotated protein sequence.
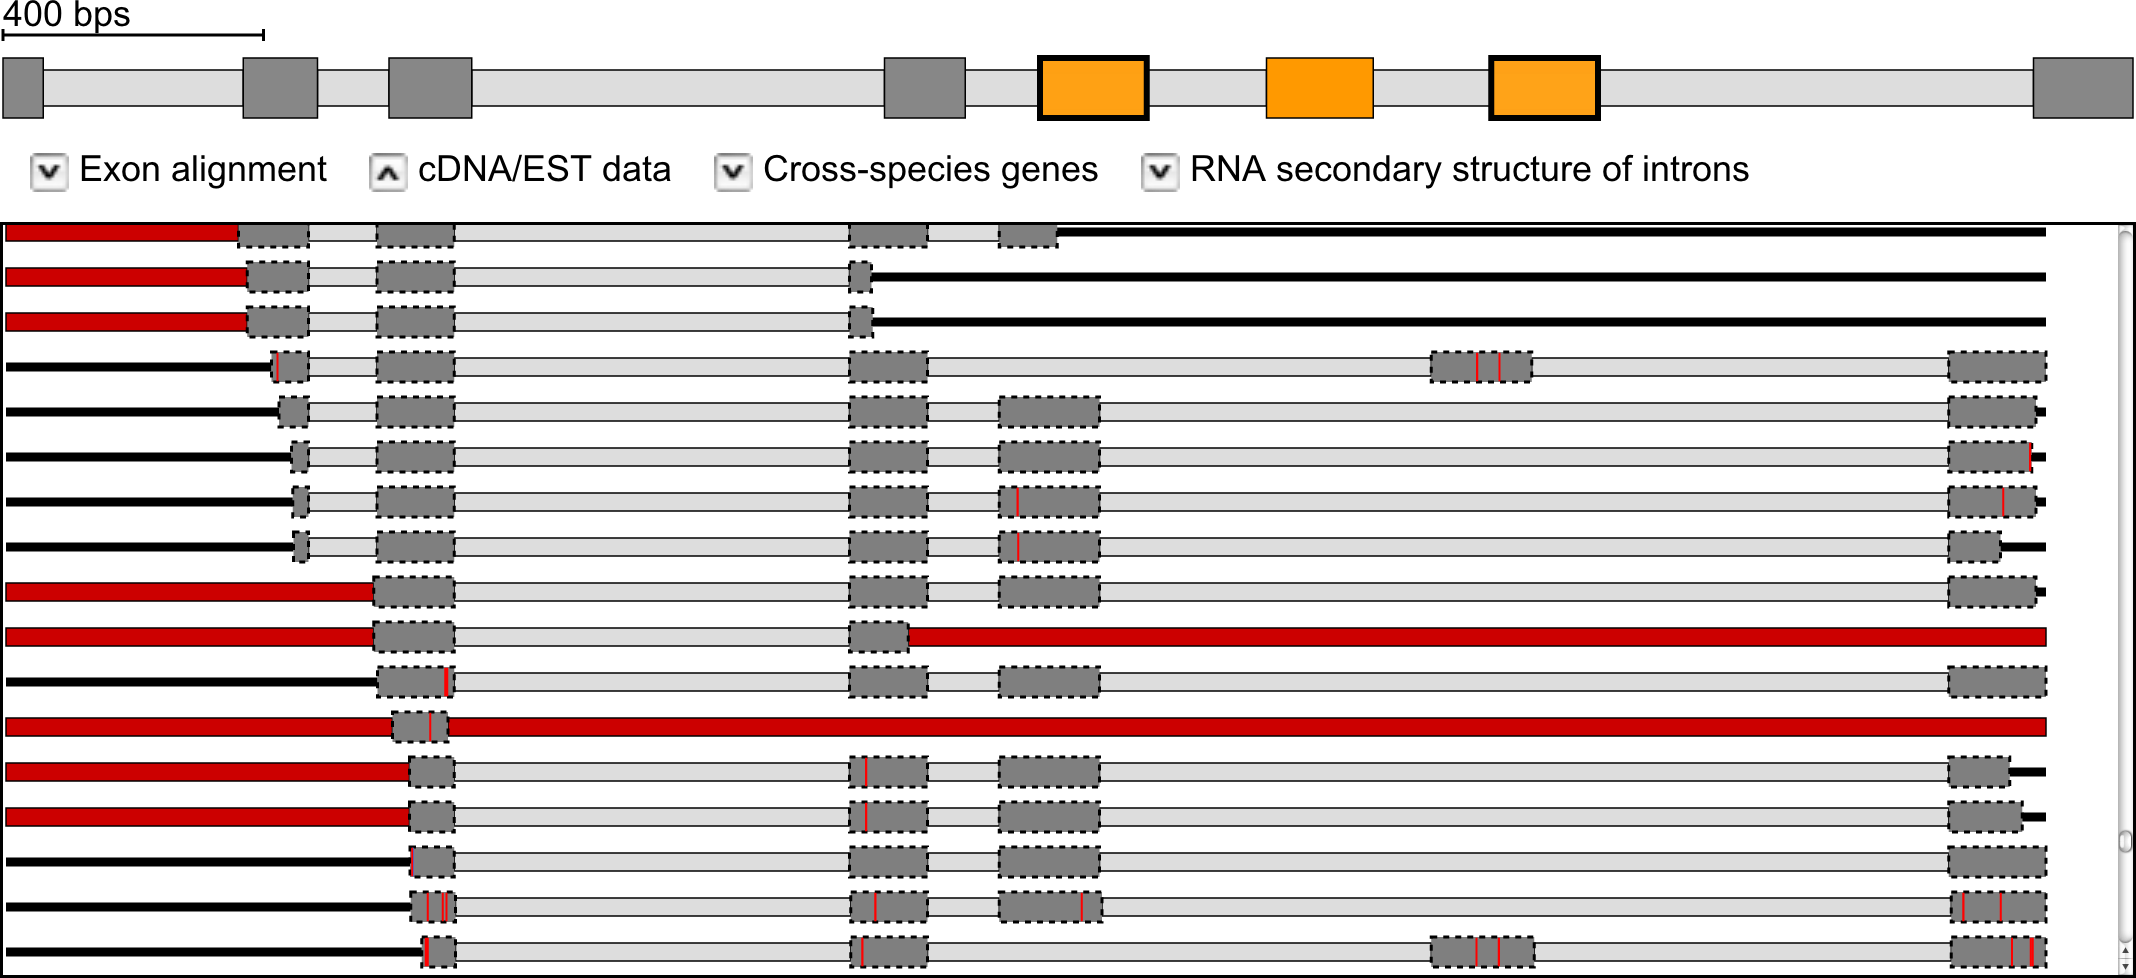
Example: Exon-intron structure of the Drosophila melanogaster 14-3-3ζ gene containing a cluster of three mutually exclusive exons of which the outer exons are supported by cDNA/EST data (marked with bold borders). The scheme on the top represents a summary of the mapping of all clones. Below, the mapping of every single cDNA/EST clone is shown with the same colour coding as explained in the legend.
Evidence from cross-species searches
Further confidence to the predicted mutually exclusive exons can be obtained from similar searches in the homologous genes of related organisms. Thus we used Scipio's cross-species search option to identify and reconstruct orthologous genes in related species. The reconstructed gene is then used as basis for the prediction of mutually exclusive spliced exons. Here, the default parameters were used for the prediction, except that mutually exclusive exons were searched not only in the surrounding introns of the exons but in all introns. These predictions are therefore independent of the ones in the original species. If the related organism is also included in Kassiopeia the homologue gene annotation is shown in addition.
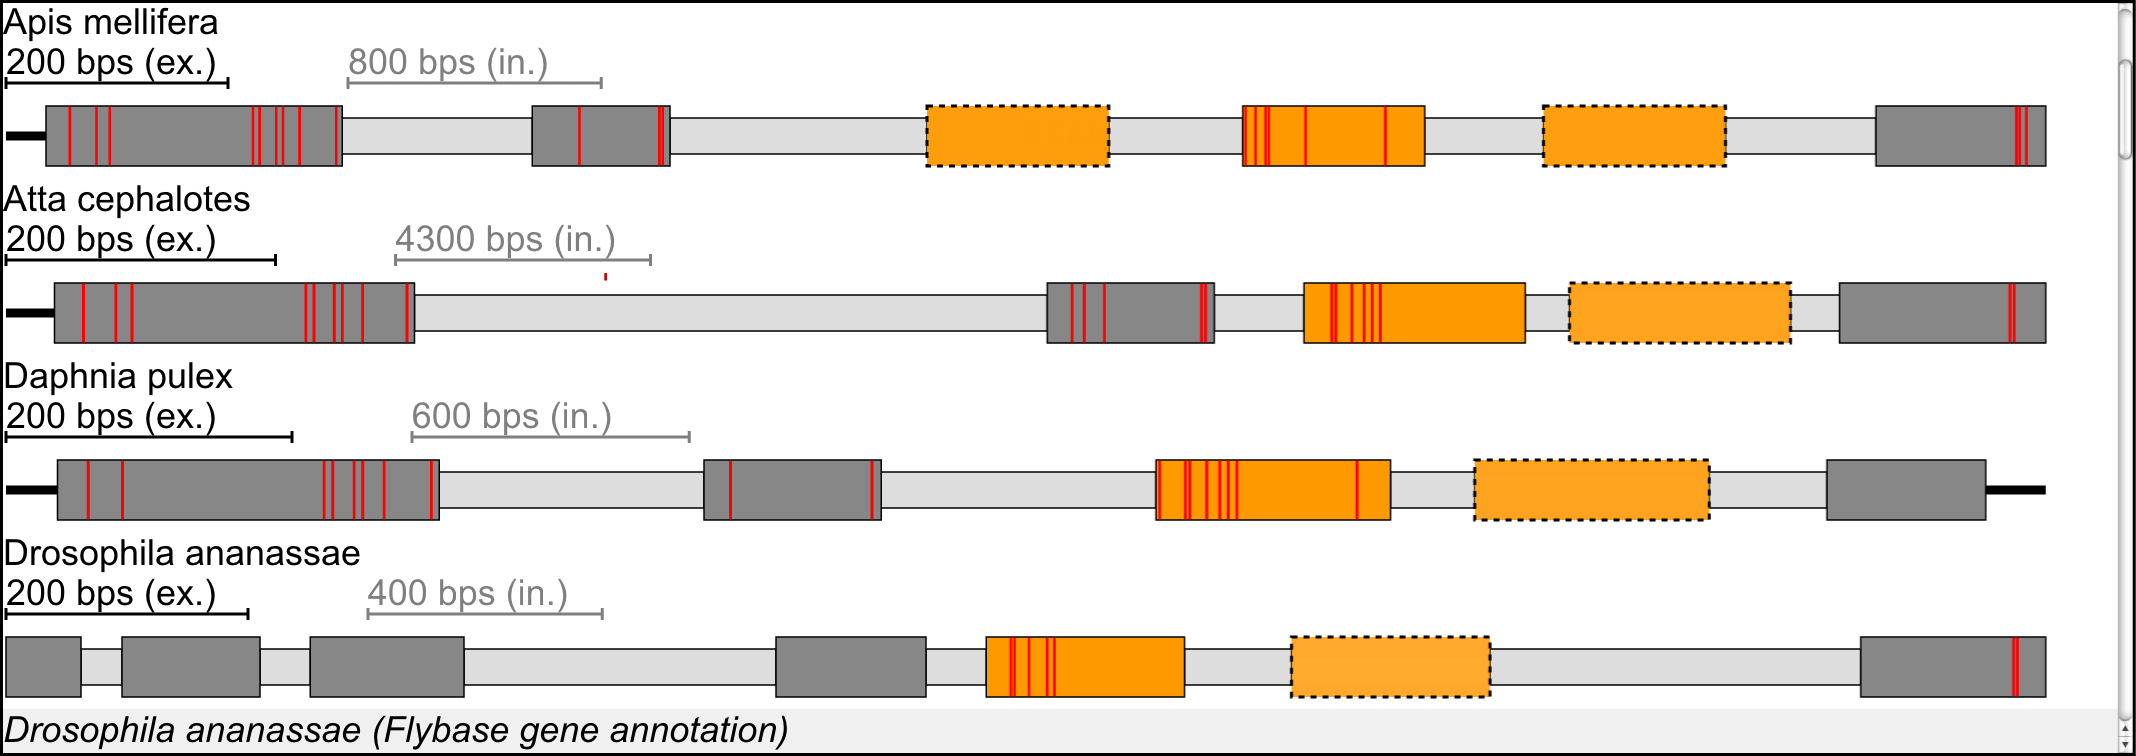
Example: Exon-intron structure of the Drosophila melanogaster 14-3-3ζ gene containing a cluster of three mutually exclusive exons of which the outer exons are supported by cDNA/EST data (marked with bold borders). The part below the gene structure scheme lists the results from cross-species searches. Coloured exons represent mutually exclusive exons. In this specific example, homologs for the Drosophila melanogaster 14-3-3ζ gene were found in honeybee (Apis mellifera), the leaf-cutter ant Atta cephalotes, the water flea Daphnia pulex, and several other Drosophila species.
RNA secondary structure predictions
Mutually exclusive splicing can be directed by competing intron RNA secondary structures, which has first been observed in Drosophila, but might also exist in mammalian species. Such competing RNA secondary structures are not found in all clusters of mutually exclusive spliced exons. However, their identification would provide strong further confidence to the predictions. The binding windows for the prediction of RNA secondary structures in the introns were calculated using a genetic programming algorithm. The first step in this process is the identification of binding windows within the intron preceding the cluster and the internal introns of the cluster, and within the intron following the cluster and the internal introns. Binding windows were predicted for all candidate clusters of mutually exclusive exons using the SeqAn and the ViennaRNA packages, and, subsequently, also for the available exon-intron gene structures from the related species as obtained in the cross-species searches. For the latter, the identified binding windows of all homologous genes from the different species were aligned using MUSCLE and the RNA secondary structures predicted by RNAalifold from the ViennaRNA package.
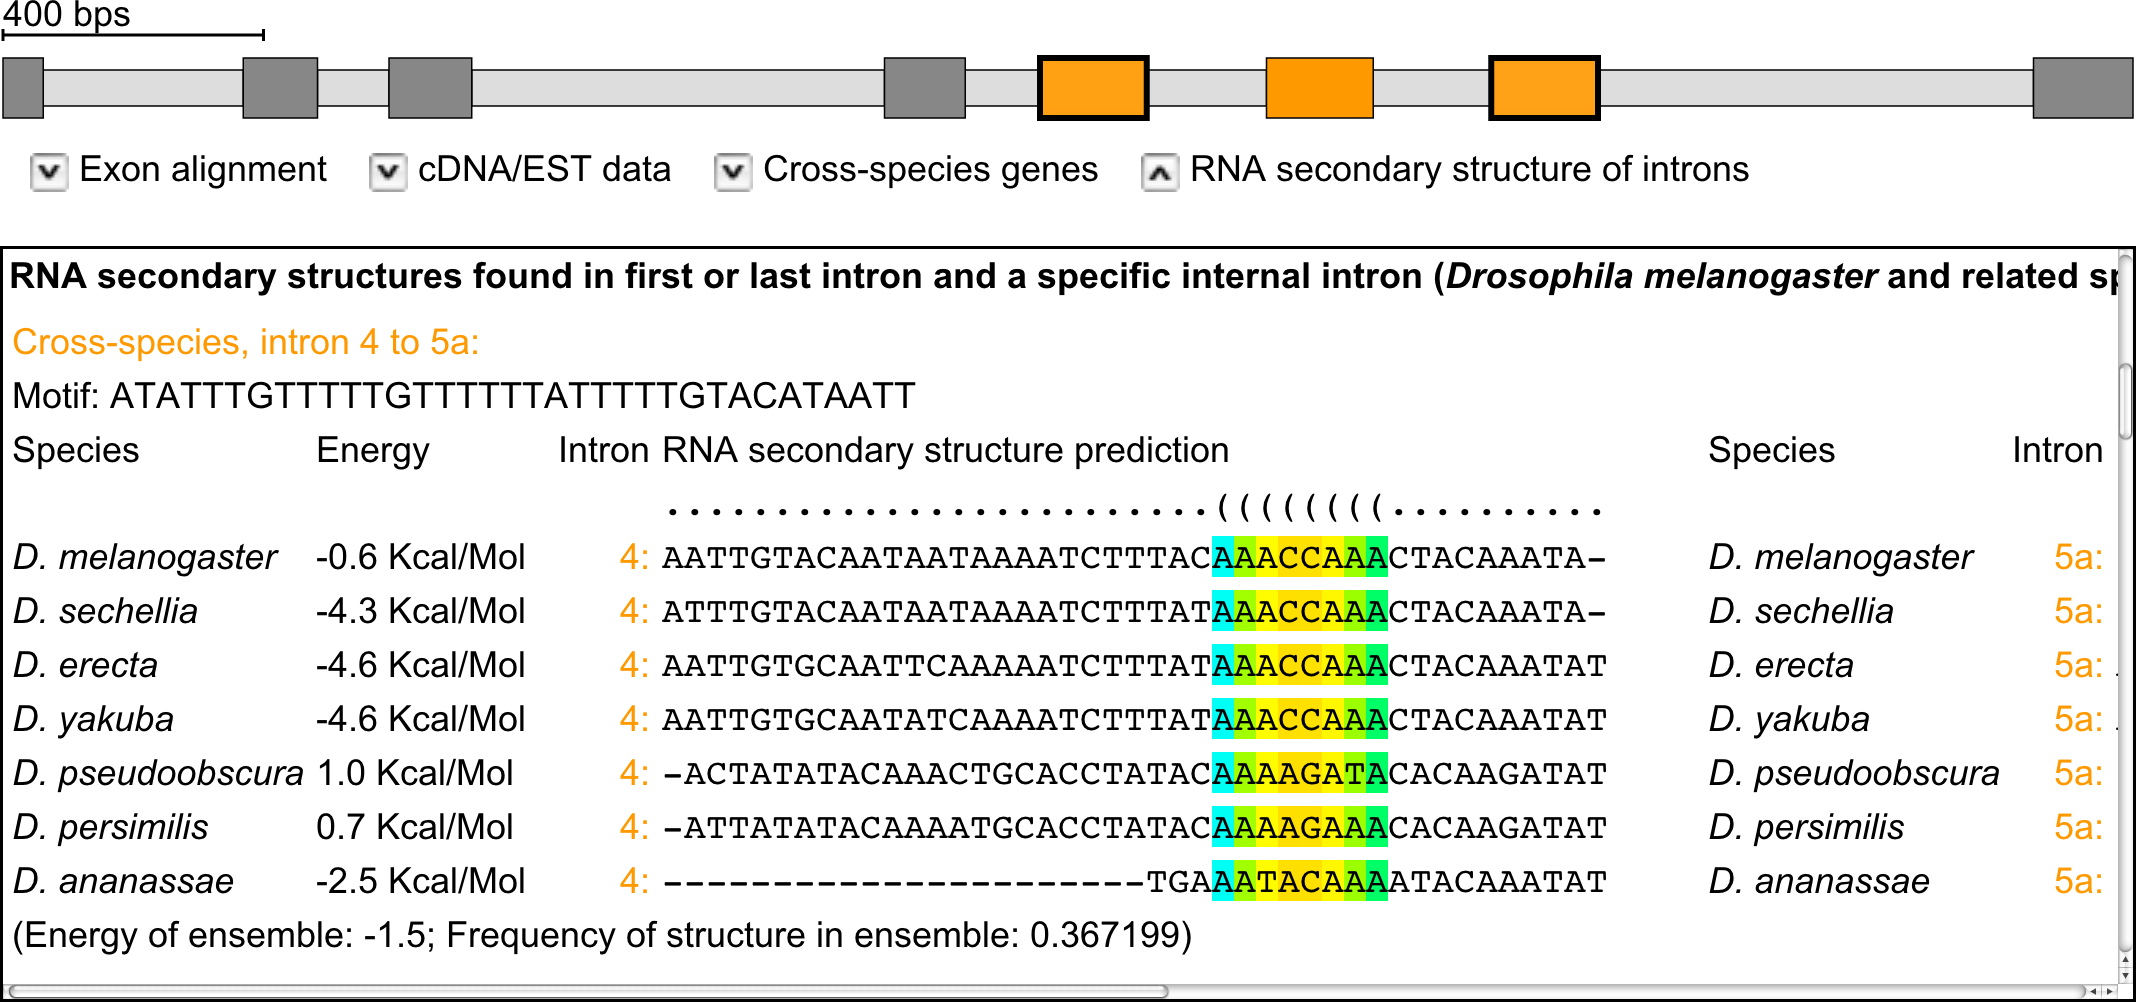
Example: Exon-intron structure of the Drosophila melanogaster 14-3-3ζ gene containing a cluster of three mutually exclusive exons of which the outer exons are supported by cDNA/EST data (marked with bold borders). Below, potential regions for RNA secondary structure formation are shown. The strength of the potential interaction is represented in colour from week (blue) to strong (red).


